Hi,
is there a way from LP and HP to obtain also the BP output from the Ladder/VCF filter?
Thanks
Something like subtract the LP & HP outputs from the original signal?
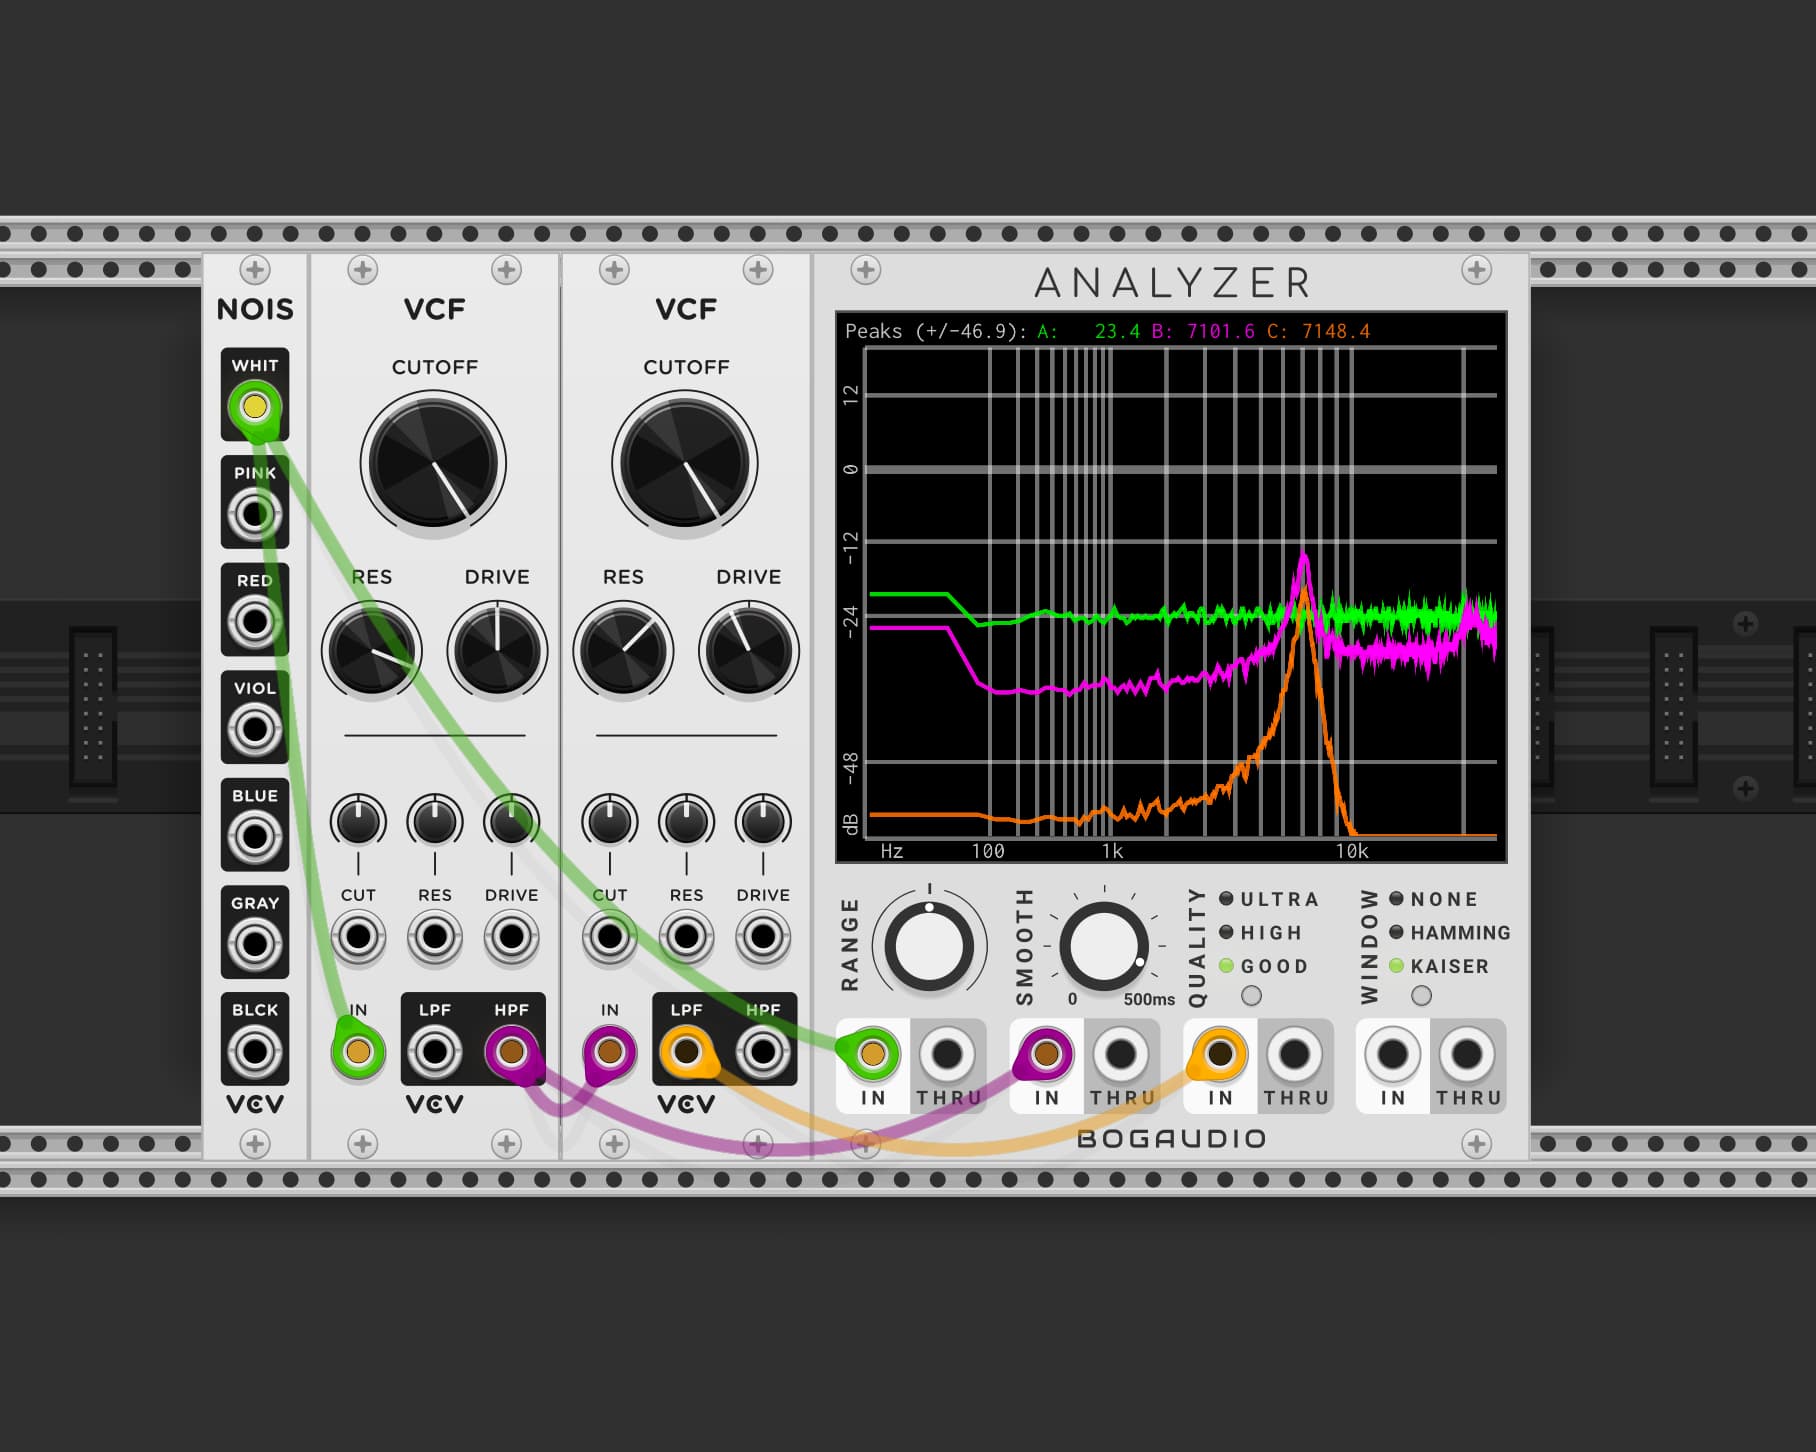
My first thought would be to use two in series. Green trace is the original noise, purple trace is high passed, orange trace is high pass with a subsequent low pass.
I am unsure if you are asking how to do this in code, or by using the module, but as this question is in the development section, I shall assume code.
The code linked in the original post is for a four-stage ladder filter. Varying filter modes can be obtained by mixing the outputs from each stage. The following diagram I made for another project shows this, with the coefficients for each stage shown as A, B, C, D, E.
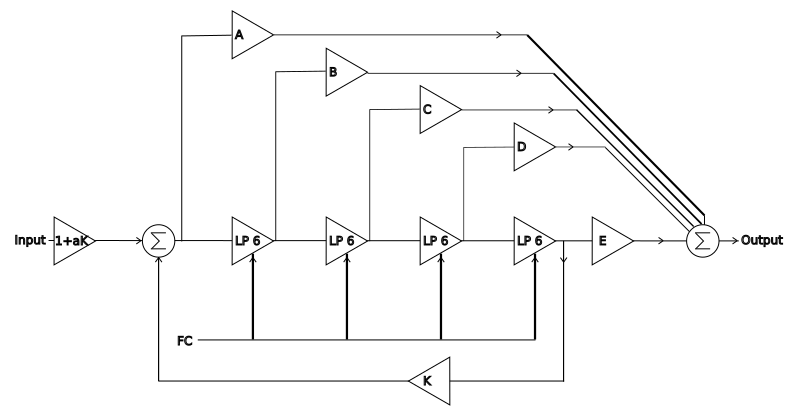
The coefficients for some of the various modes (provided by electric druid) are
if we look at the code https://github.com/VCVRack/Fundamental/blob/v2/src/VCF.cpp#L60
we can see this function:
	T highpass() {
		return clip((input - resonance * state[3]) - 4 * state[0] + 6 * state[1] - 4 * state[2] + state[3]);
	}
if we break this down
(input - resonance * state[3]) is the input and resonance feedback, shown as stage A above. - 4 * state[0] stage B+ 6 * state[1] stage C- 4 * state[2] stage D+ state[3] stage EAs the phases change by 180 degrees on each phase, you may notice the coefficients have alternating signs, it is important that this is maintained.
The coefficients for the highpass as implemented are {1,4,6,4,1) and these match the coefficients given for a 24dB highpass.
Now you can update that function to become a 24dB bandpass by using {0, 0, 1, 2, 1}
return clip(0 *(input - resonance * state[3]) - 0 * state[0] + 1 * state[1] - 2 * state[2] + 1 * state[3]);
If you want some more reading on pole mixing filters I can recommend https://electricdruid.net/multimode-filters-part-2-pole-mixing-filters/
Or for those that would prefer a book or to just read about the digital domain: Designing Software Synthesizer Plug-ins in C++, Pirkle, 2015, Amazon.co.uk
If you want to try out various coefficients and experiment with ladder filters, you could try one of my modules, Bascom, along with its expander.
If you place the expander to the right of Bascom, right-click the expander module, and look at the presets, this can be used to quickly select the coefficients.
@Curlymorphic wow man, thanks! Lots of useful info right there. I just need to collect each piece all together! Very kind, thanks. And yes, I was meaning “by code”, cloning the module.
Could I ask one more question? I’d like to plot the freq response of the filter. The straight way I think it impulse → fft → filter> ifft.
Is there some fancy code I can use in Rack to doing it out of the box?
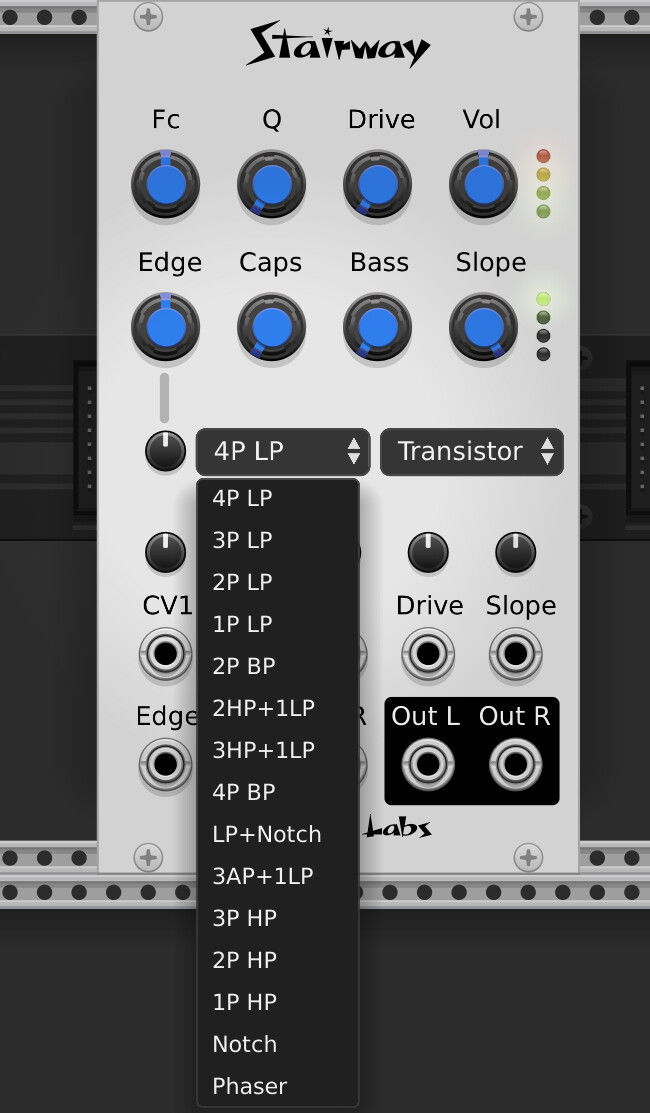
btw, the manual for my “Stairway” links to some good papers on how to get many responses from a 4 pole ladder filter.
In terms of measuring freq response, yeah, doing an FFT is pretty easy. Expecially assuming you want to do it “offline”. An easy way to do it “online” is with BOGAUDIO RANALYZER. Most people don’t know about this module, so they use noise and fft analyzer.
btw, if you do FFT you need to compensate for the freq content of the trigger signal. Either divide out the FFT of the input, or use an input that it totally flat, like my “Colors” module (most noise generators are not completely flat).
As I say, my Stairway uses that trick, and uses the responses from one of the papers:
Stairway manual: SquinkyVCV-main/docs/filter.md at master · kockie69/SquinkyVCV-main · GitHub
if you want to plot the frequency response, impulse > filter > fft, so basically you feed an impulse into your filter, then the output to an analyzer. you can write a simple module to output an impulse on trigger, or just use a sample
Now if you want to do this testing in code, I can highly recommend reading @Squinky old unit tests. I think I learned 99% of what I know about unit testing dsp from studying and adapting these for my own use. I am not sure if these are still on Git Hub, maybe Squinky can point you in the right direction. If these are no longer available, I can give you a link to mine but Squinky is a professional coder, im just a hobby hacker.
Oh, I can also recommend unit testing and TDD for dsp, it may seem like a lot of hassle, and not always done, but has made my time so much easier in the long run.
Thanks. Yeah, the old unit tests don’t work any more with VCV 2.0, but they are in the github with the code.
Of course a true “unit impulse” is infinitely high and infinitely narrow. Maybe a single sample of “one volt” will work? In my old unit tests I used a swept sine. Mostly out of habit, but if you are measuring something “analog” it really matters - swept sine has a very high “crest factor”, and impulse is almost unusable. But - we aren’t talking about analog, so that’s perhaps irrelevant. Anyway, my old unit tests used a swept sine.
Yes sure, but there isn’t on some place a script which use pffft on Rack which get the impulse response and I can just use it without reinventing the wheel and simply use tools inside Rack?
Ok, I’ve write the code to do the FFT. But with some heavy settings (res in particular), the plot its very weird, almost not usable.
Are there some paper where there’s the related transfer function of this filter? So I can improve the plot drawing the exact response in magnitude? You know?
Do your plots look the same in RAnalyzer?
If not, maybe all the code you need to generate the plot is there to study / use.
my memory is that ranalyzer does not use a complex FFT, so it loses phase info. But I may be wrong. When I did it like 20 years ago I did responese = complex_fft(output) / complex_fft(input).
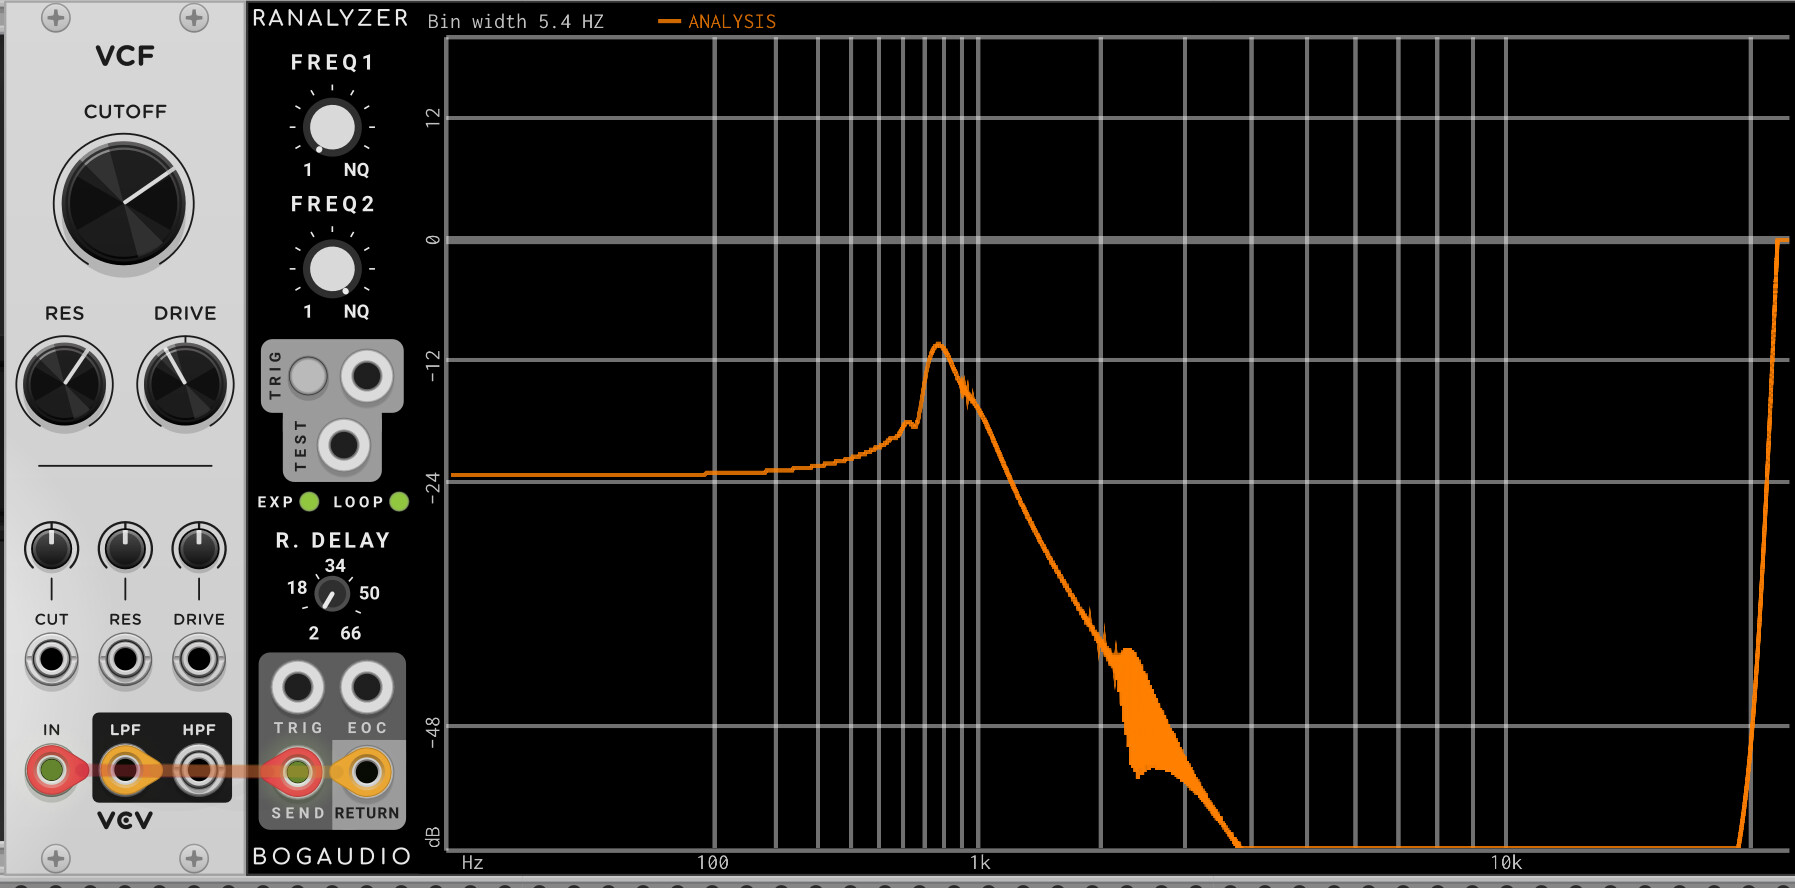
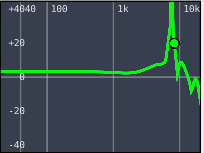
Not sure if I’m using and interpreting it correctly, but also with RAnalyzer it seems the plot doesn’t match the actual response (settings: 8000hz, 100% res which is 10.0, default drive):
they looks way different ![]()
I do the same, but with the same settings above, that’s the plot:
It seems to works “nice” till res 4.0, than it start to going crazy…
What in particular looks different between the ways of measuring response?maybe I’m missing it, but they both look similar to me. And when you say yours goes crazy at 4K, what do you mean? Also, does that vcf oscillate when the res is that high?
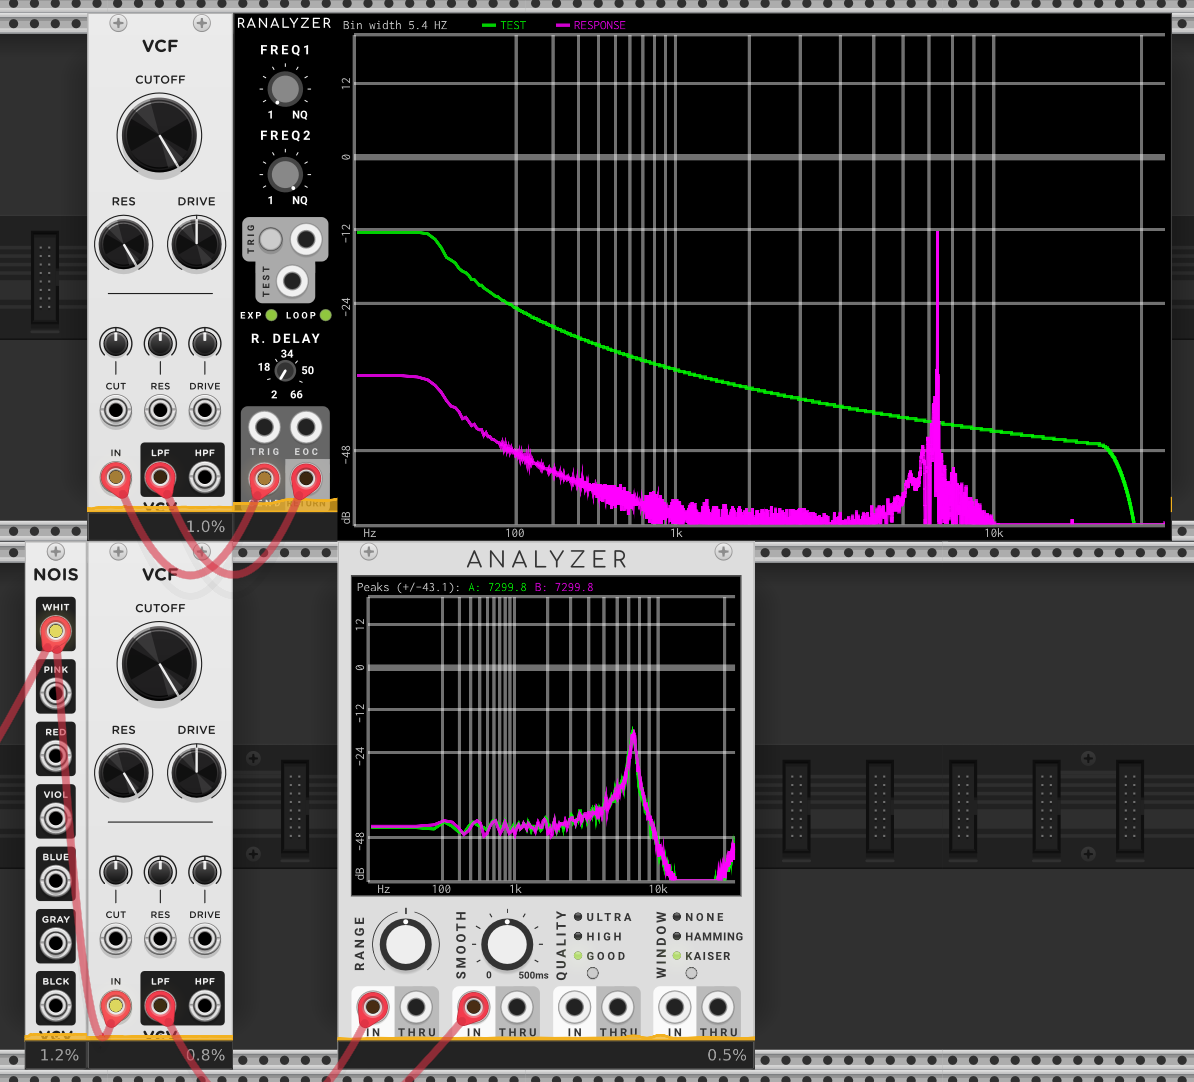
In which way RAnalyzer and Analyzer plot are the same? The ramps are different (given the same freq/amp scale).
Also, what do you mean with 4k?
The pink lines on both show a high resonance at 8k. The green lines represent different things, and aren’t important.
sorry, that was a mistake. The correct question is “you say it goes crazy with res > 4”. In what way does it go crazy?
Also - what windowing function are you using? Depending on what you are doing you need to do that.
Many filters do strange things at very high frequencies. Why are you making measurements at 8k? Why not something easier, like 500hz?
The bogaudio analyzers work better at “ultra” quality. I don’t know why they default to “good” (i.e. bad).
Also, if you set the vertical resolution to 96 db you would see more into that dip above 10k.