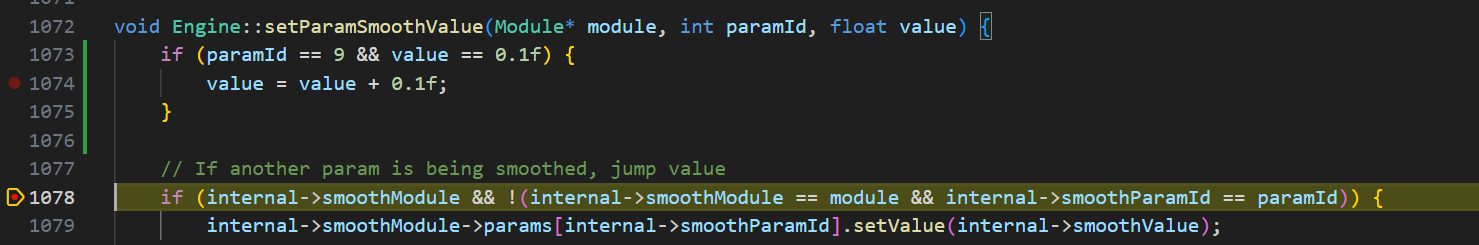
it ONLY stop at 1078. So can’t catch that condition, and not able to debugging at all (at 1078 it will trigger for each Param’s change, not only paramId 9 and value = 0.1).
What can be done? I compile with -O0, isn’t enough?
Seems a bit better, but still a pain Can step-back be activated in VSCode/gdb? I would like to step back on previous lines of code, seeing how the situation was before that instructions etc.
@baconpaul For this specific case, I can intercept exactly 0.1f.
Well except it seems you can’t because the debugger won’t stop
debuggers are great but when the fail me I often debug with print also. If you put a std::cout << "HERE" << std::endl in the if statement, do you see it and still not get a debugger stop? I would just do that to eliminate any ambiguity about values vs debug infrastructure.
sure I see it. Its like it can’t reach that exact point, dunno why. -ggdb3 seems help anyway.
Now: that’s not enough. I need to go step back instructions by instructions, since I think I’m in the territory of pointer alias and/or memory leaks, and its hard with breakpoint and debug message.
Is it possible to setup this feature with gdb (in VSCode, Windows/MinGW)?
UPDATE: tried -exec target record-full on DEBUG CONSOLE, but it says Process record: the current architecture doesn’t support record function. Can’t we do it on Windows with my actual architecture?
I use clang in clion on mac and gcc in clion on linux
i have never stepped backwards but see my mac can’t seem to do it - and doc shows this as a gdb not lldb thing on a quick google. I don’t have a linux box with me now to check but the clion doc indicates it would work with gdb on linux.