hi,
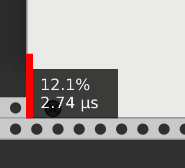
i’m building a module which reach more or less 12% of cpu “in isolation”:

now, if I insert on the patch another module (i.e. Trummor2 with 16 poly channels), my module CPU decrease:
what’s the reason about this?thanks
hi,
i’m building a module which reach more or less 12% of cpu “in isolation”:

now, if I insert on the patch another module (i.e. Trummor2 with 16 poly channels), my module CPU decrease:
what’s the reason about this?thanks
Draw routine prefetch?
that’s kind of weird. Are the CPU meters stable on your system? With my old audio card they were totally unstable, With newer hardware and nice asio drivers it’s much better. Also, if the number are too small, I switch to some insanely high sample rate to make them bigger. But your numbers already look plenty big. In fact that number seems crazy big for that module. Is your computer super old? But, in any case, I don’t have an answer, and that isn’t what I experience. Don’t know…
my pc is quite new and good. one thing: im running with native (internal) soundcard, and ASIO4ALL (no dedicated external device). but in general, with other vst/daw is quite ok.
please notice that you are running “Trummor” (not Trummor2), and mono (1 channel). here’s the same more or less (0.6%). Try set poly (16 channels):
and than try Trummor2 poly (16 channels).
which % do you reach?
Oh, sorry. My mistake. When I measure Trumor2 with 16 inputs it’s around 20% on my not amazing PC.
so we are, more or less ![]()
the trouble still here: why adding more modules, it reduces the overall cpu meters ![]() also using only Trummor2. one instance:
also using only Trummor2. one instance:
two instances:
it makes no sense to me ![]() …
…
Yes, I agree it’s curious, and I don’t have an answer. I haven’t observed that happening, but I have seen odd things. That’s why I mentioned that will my old sound card they were all over the place.
It is odd, but as a practical matter it probably isn’t too bad if your meters are off by like ten percent or something.
I don’t know if it has any relation to the thread, but a similar question comes to me, why do modules tend to use more cpu as I increase the number of threads? It happens to me on both linux and windows.
Yeah, that happens to me, too. I guess the feature is still usefull to me for spotting “which module here is using up all the CPU”? I don’t tend to use it for super accurate comparisons or other measuring.
i basically use it for “performance”. should i use a profiler? never used it. do you? maybe can be the correct moment to try it out.
i’m on windows 10, vscode. any tips/starting point/tutorial?
When I need super accurate numbers to tell if something I did made the CPU go up or down I use my own tests that run the DSP part (but not the UI part) in a command line program. It basically measures how many process calls can be done in a second. some details here: SquinkyVCV/unit-test.md at main · squinkylabs/SquinkyVCV · GitHub
When I want to compare my CPU usage against some other plugin I use the meters just like you do. Usually the results are ok. Sometimes I’ll put in like 4 of mine and 4 of theirs so I can get a better “average”. And like I said if the numbers are too small I crank up the sample rate of VCV to make them all bigger.
I have a hypothesis, could it be possible that the mmeter refers to the specific use of each cpu, if I have four modules, the percentage is calculated in relation to the threads used? For example, if I have three modules, (MIDI audio and a VCO) do they require using a single cpu thread, but when adding the trummor a new cpu thread is used lightening the load of the first cpu, resulting in less use for the meter?
this really intrigues me, it’s midnight here and i’m like he-man pensive in bed

I think it has to do with software and hardware prefetching.
The compiler or programmer and the cpu can have various tactic for faster code execution by pre-fetching data to load it into caches. The caches are local to each core - being invalidated if the thread moves to another core. That’s one reason you see larger loads when using more threads - particularly on a multi core system i’m guessing.
Oh, yeah, cache issues! Forgot about that. With more block oriented plugs, like vst, you can get big wins by watching your memory layout. With vcv being single sample I don’t know if that helps in a real patch. But definitely a plausible reason to the meters might change with patch.
It doesn’t explain why the CPU decrease with different modules. In theory, you add content than need to be processed, so basically you increment the amount of potential cache missing.
The more you need to process, the more CPU increase. Here instead decrease  and i really can’t see why… you will saturate cache pipeline more using more modules…
I dont know … I tried to analyze in Ms Visual studio 2019
The visual studio profile on the left is for 1 trummor2 module - the one on the right is for 2 trummor modules.
1 tread, non-realtime selected in Rack.
Rack.exe test01.vcv (1 trummor) Rack.exe test02.vcv (2 trummor)
I tried selecting the first 15 sec in both cases.
I don’t have much experience in interpreting these results. VS 2019 community is free of charge.
TLDR: It’s still a mystery
Interesting, I hope someone figures it out, I’m confused. I have looked at how the profiling in Rack works though so can share my thoughts on that.
I wouldn’t rely on these numbers for profiling, it’s a measure of lots of very short durations and it’s full of noise. On mac I’ve had success profiling using Instruments, on Linux with oprofile, but on Windows I could never get anything like a sampling profiler working.
On Windows the Rack timer code uses QueryThreadCycleTime, the documentation for that function says not to attempt to convert it to elapsed time, but Rack just assumes the counter always runs at 2.5GHz. So you can’t rely on these microsecond numbers being accurate. That doesn’t explain why it appears to decrease after adding a module though.
Rack does a few things:
Rack doesn’t time the draw routine, only the process call and the percentage is a percentage of the sample time used, not the percentage of the CPU used.
CPU instruction / data cache could explain the speedup when both modules are the same. It’s possible with one module its instructions / data were always evicted from the cache so it always paid the price of populating it. With two modules, either one of them always pays the price, causing one to appear fast and the other slow, or it’s random which one pays the price and both appear a bit faster.
I thought it could be related to the OS increasing the CPU clock frequency when there’s more load, but then you’d see time reduce in the other modules too.
If you’re interested in the Rack code for this it’s around here:
I found profiling to be difficult, but luckily for me I worked on that a long time ago, and have not had to update. I run the processing part of the plugin in a tight loop ‘n’ times and see how long it takes. Then I keep doubling n until it takes more than a second. If feed the inputs with random numbers, and I save off the output. If I did not do that the optimizing compiler would realize my module doesn’t affect anything, and would optimize it all away. Obviously this method only works for programmers who want to deal with this.
This easily gives me accuracy of 1/10 of a percent. But for just comparing two modules you don’t need that accuracy. Sure you are measuring a bunch of short things, and it’s noisy. But it works fine for me. It’s not that unstable. What I do to compare A to B is insert four of each module, patch them up, and turn on the meters. If the numbers are too small, I increase the sample rate until the are big enough.
As I’ve said before, this works fine for me. On my old sound card it didn’t work at all, everything would jump around.
If you can’t get decent results, there is something wrong with you system.
I started a new thread about the cpu meters in general: Tricks for using the CPU meters effectively
If anyone is thinking of using Squinky.Labs testing and profiling code, I can highly recommend it. Just be careful not to get too obsessed with the numbers. I must admit trying out the same code with various compilers and OS’s and being shocked at the differences of similar common functions such as sin() abs() tanh().
Its amazing how much you can learn about your own code, with some simple testing and profiling.