Silly Saturday afternoon doodling:
The patch: vcv.vcv (8.0 KB) I can’t play it without audio buffer underrun on my PC, needs too much time. It was created with this SVG file, and then using this Python script to create the formula. Easiest to replace the two formulas with a text editor in the VCV file, which the Python script outputs at the end, if you want to create your own graphics. Remove the trailing “+”.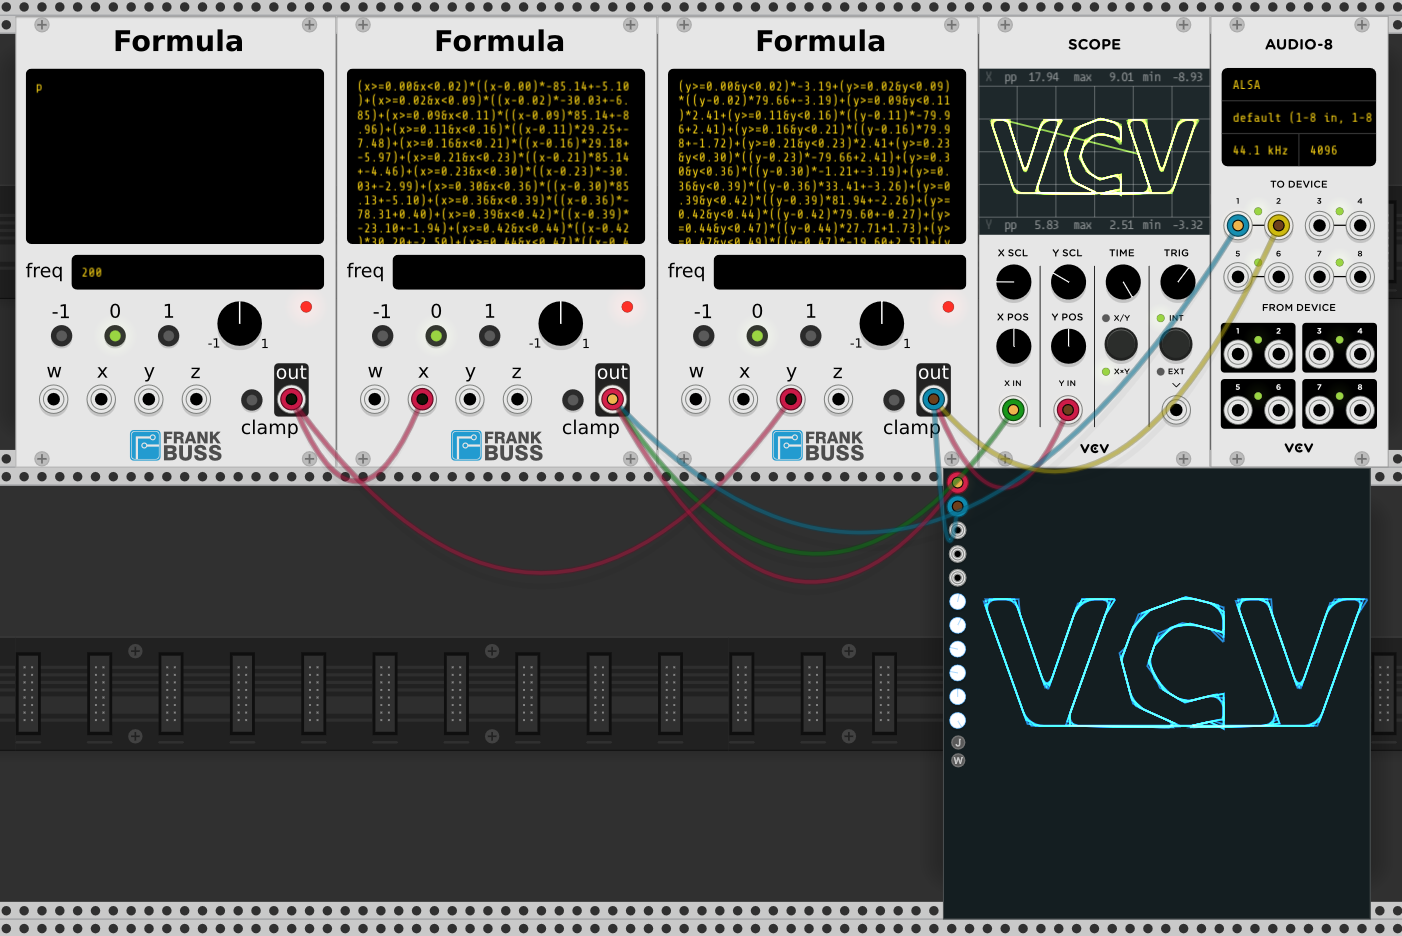
8 Likes
Could you explain this a bit more detailed for total beginners and p(python/coding) illiterate peeps like me
1 Like
 what does that even sound like?
1 Like
First you install Python 3. Then open a command prompt or shell and start the script, like “python3 vcv.py”. It will output 2 long lines, starting with “(x>=0” and “(y>=0”. Maybe best to save it right away in a file, with “python3 vcv.py > out.txt”. Then start a text editor, like Notepad on Windows, open the vcv.vcv patch, and replace the two formulas with the output (search for “text”, or just scroll in the file until you see the previous formula). To edit the vcv.svg file, I recommend using Inkscape.
1 Like
3 Likes
thank you, I hope I understand it
1 Like
I tried to do this with several simple svgs and it had trouble. It seems want something specific to make it work right.
2 Likes
It works only with straight lines, no curves, no objects, no groups or transforms etc. In fact I did use a second layer in Inkscape and typed the text, then locked the layer, and traced it with minimal number of lines on another layer by hand, then deleted the first layer.
1 Like
ah I see I was trying that but with circles and curves. I will try to trace with just straight lines. Thanks.
1 Like
It’s not my script, but your scope  If you want to emulate a real analog scope, then the fast transitions should be barely visible. But don’t know if it is worth the effort, it would need much more time then for drawing.
1 Like
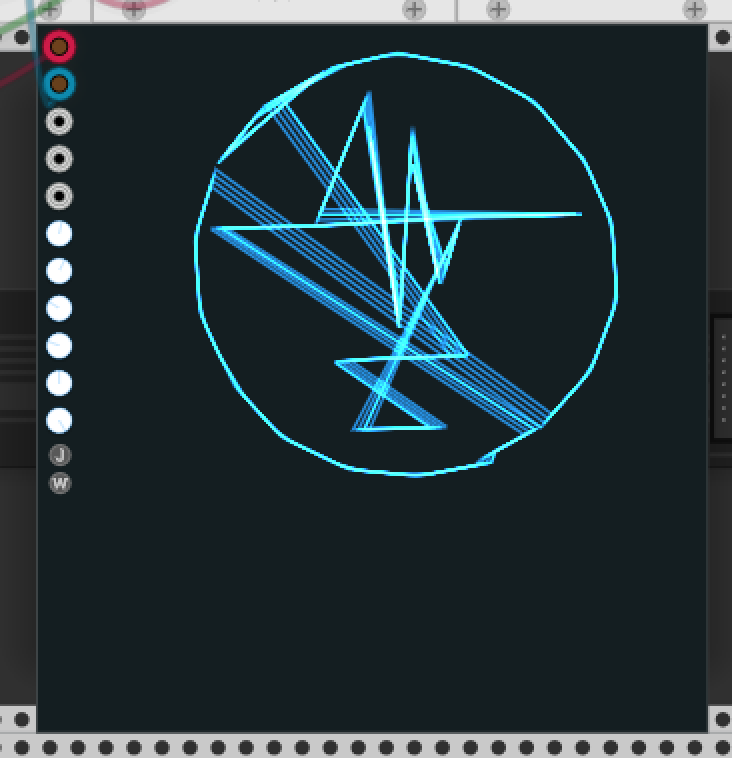
JW is easier 
4 Likes

5 Likes
@jeremy send me your logo and I’ll use my superscript (Wolfram Language made) that generates the data. I could add it to my Vult blank / logo generator.
2 Likes
oh cool. Being in the blank panel would be cool. Here is a link to my logos in svg and png:
Thanks @David ! Looks good
I wanted to comment about it, but I forgot. The method I’m using to create the lines is based on detecting the borders of an image. From there, I detect all continuous lines. To ease the tracing I generate the fourier formula of the whole curve. Important, I go twice over every line to better draw it. Once having the formula I can sample it and create a second order interpolating function.
Here’s the code I used as base for my algorithm: https://blog.wolfram.com/2013/05/17/making-formulas-for-everything-from-pi-to-the-pink-panther-to-sir-isaac-newton/
1 Like
This looks very complicated and needs more processing power the more complex the graphics is, same as my current formula. Once I wrote a spline Applet (probably doesn’t work in most browser nowadays because of disabled Java plugin). It needed only one polynomial of degree 3 for each curve segment, no matter how many segments I have. And the coefficients calculation is very fast and linear as well, see here for the full source code.
Drawback is that you can’t just feed any vector graphics to it, and needs some extensions to allow sharps edges as well. But this would even allow realtime modulation of the points. I was thinking of writing a waveform drawing module with it, something like the VCV Parametra module, but for drawing one audio cycle instead of a filter curve. I think this could be better than the standard bézier curve concept. Should be easy with my new Lua module.