In the following video I walk through the features of Frolic and Tricoder with a live patch.
In my recent work on the Sloth
modules for the Nonlinear Circuits plugin, I became interested in chaotic oscillators. I built a real Sloth circuit and another chaotic circuit on a breadboard and studied them. I decided to try my own hand at making a chaotic oscillator. The result is Frolic:
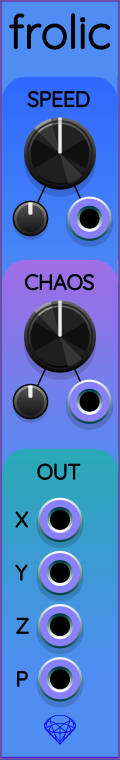
Frolic outputs a 3D signal consisting of three output voltages X, Y, and Z. It has a wide range of speed settings and an adjustable amount of chaotic behavior.
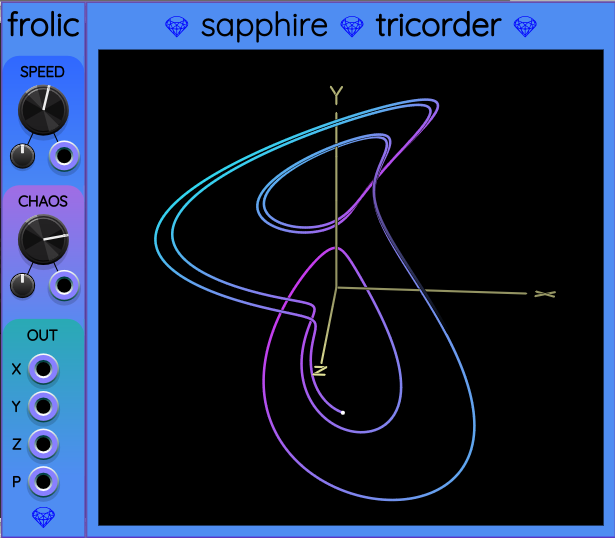
Because I wanted a clear picture of the 3D shape Frolic produces, I decided to create a 3D oscilloscope plugin as an expander module. I call it Tricorder. When you put Frolic immediately to the left of Tricorder, they automatically connect and Tricorder starts making a 3D graph like this:
Tricorder is fun to play with, because you can see a 3D animation of your signal rotating in real time.
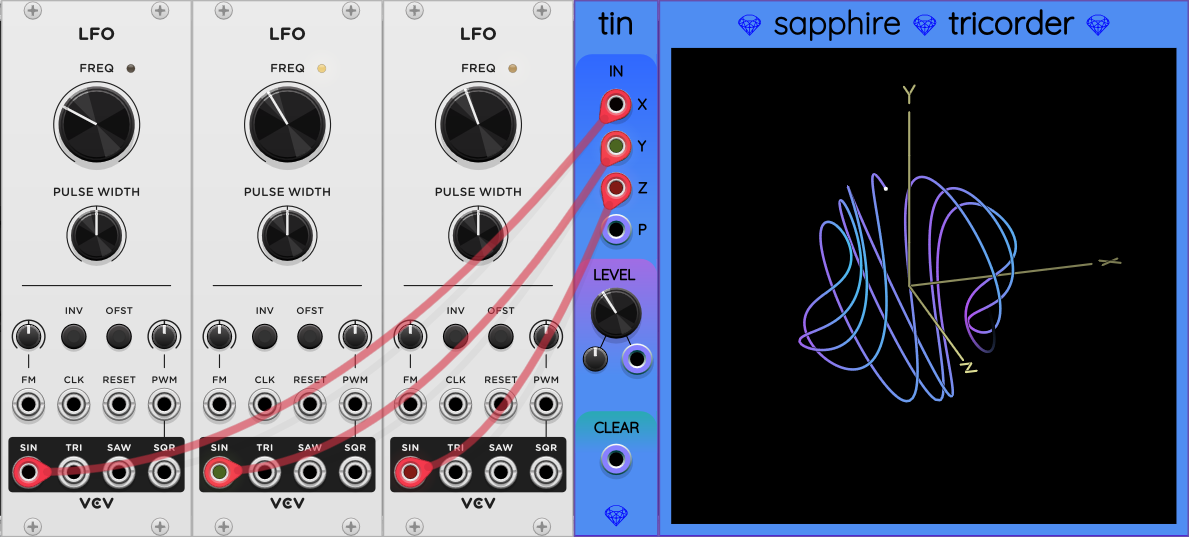
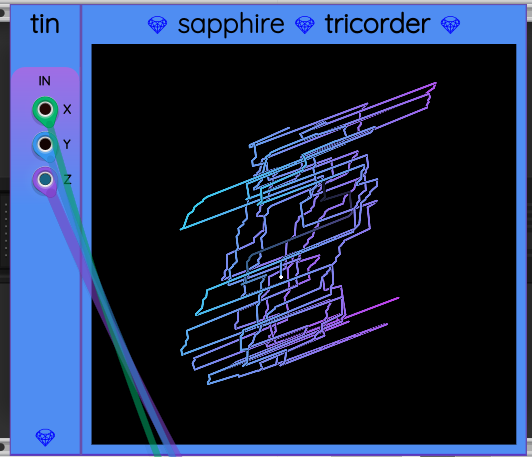
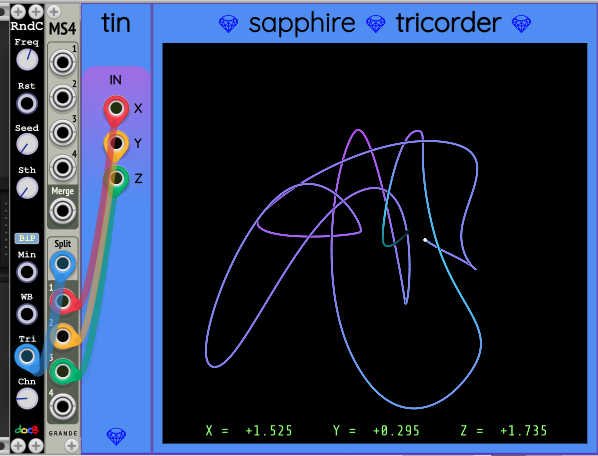
I also provide a way for you to send any 3 input voltages you want into Tricorder. It is the Tricorder INput module, shortened as Tin. You can place Tin to the left of Tricorder. Tin will send whatever it receives on its X, Y, and Z input ports into Tricorder to be graphed. Here is an example of what this looks like:
Here is an example where I improvise a deep drone with Frolic and Elastika:
As always, I’m eager to see and hear what you do with these new modules. Feel free to post your own recordings here. And I look forward to any issue reports or feature requests you wish to report here or on the Sapphire repo on GitHub.
Yeah - I posted that comment before I watched either video. Just reading the description had me excited. I now see you already have great user control. Just CV control is missing. A 2nd expander might be nice so that CV control can work with Tin or Frolic.
One other thing to consider would be support for polyphony. Maybe different colors for each channel?
I thought about polyphony but I was already concerned about the graphics overhead per call to step(). I’m also not sure how easy it would be to view the multiple signals mixed into one 3D space.
Currently if you feed in a polyphonic signal, I add all the voltages from all the channels into a single X, Y, or Z value. Some people might find that useful as a simple mixer.
I also currently use different colors to help distinguish depth from the viewer on the single curve I plot. I’m not sure how much that helps perceive depth, but I felt like I needed to try.
It is funny how much we all seem to like Tricorder with Tin. That was the first thing I had to try by sending in the the 3 fBm outputs from Meander. It did not look quite like I imagined it, but that may be due to the sampling frequency in Tin or Tricorder. What is the sampling frequency.
Tricorder receives audio data at whatever sample rate your patch is running. But it only updates the graph when the drawLayer method is called, which appears to be the video frame rate, 30 Hz, 60 Hz, or whatever you have in your VCV Rack settings.
The rule is that I keep updating the current point, but once it is more than 0.1 volts away from the previous point, I put a new segment on the front of the “snake”. At the same time, I fade a segment out from the back of the snake. So hopefully it looks fairly smooth at whatever your video frame rate is, while also allowing the snake to grow nice and twisty.
I don’t want to hijack your announcement, but I posted a worthless, but tangentially related and maybe entertaining topic in the Lounge about drawing snakes!