I’d like to evalutate the frequency response of a given filter using the library modules (free would be nice).
Usually I take a impulse of 1024 samples, feed in to the filter, and then set SPAN plugin with the same window in the end of the chain.
This way, I can visually see the freq response of the given filter.
Any way to do this with Rack modules?
A impulse generator + an analyser with settable window?
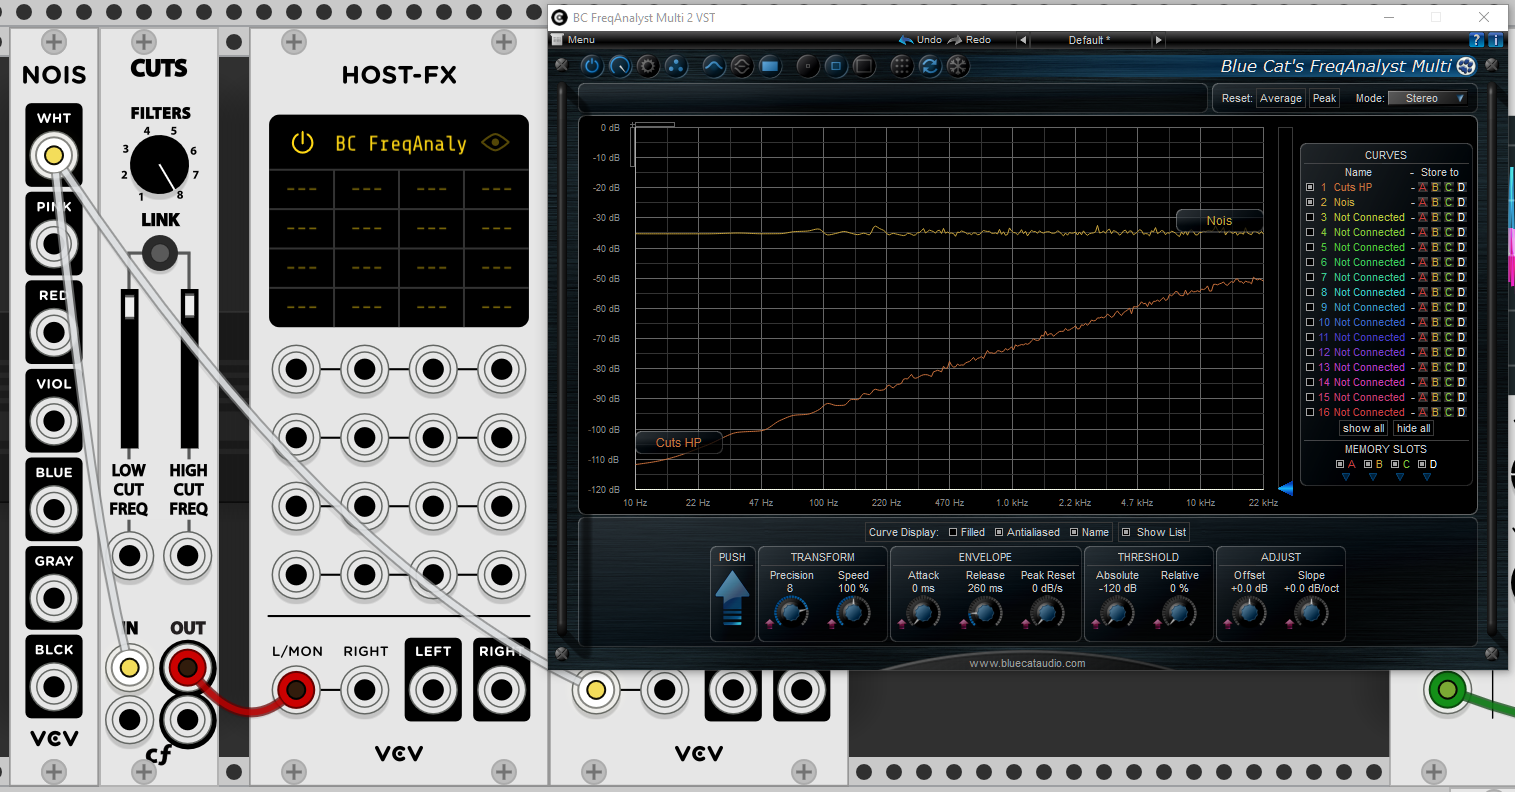
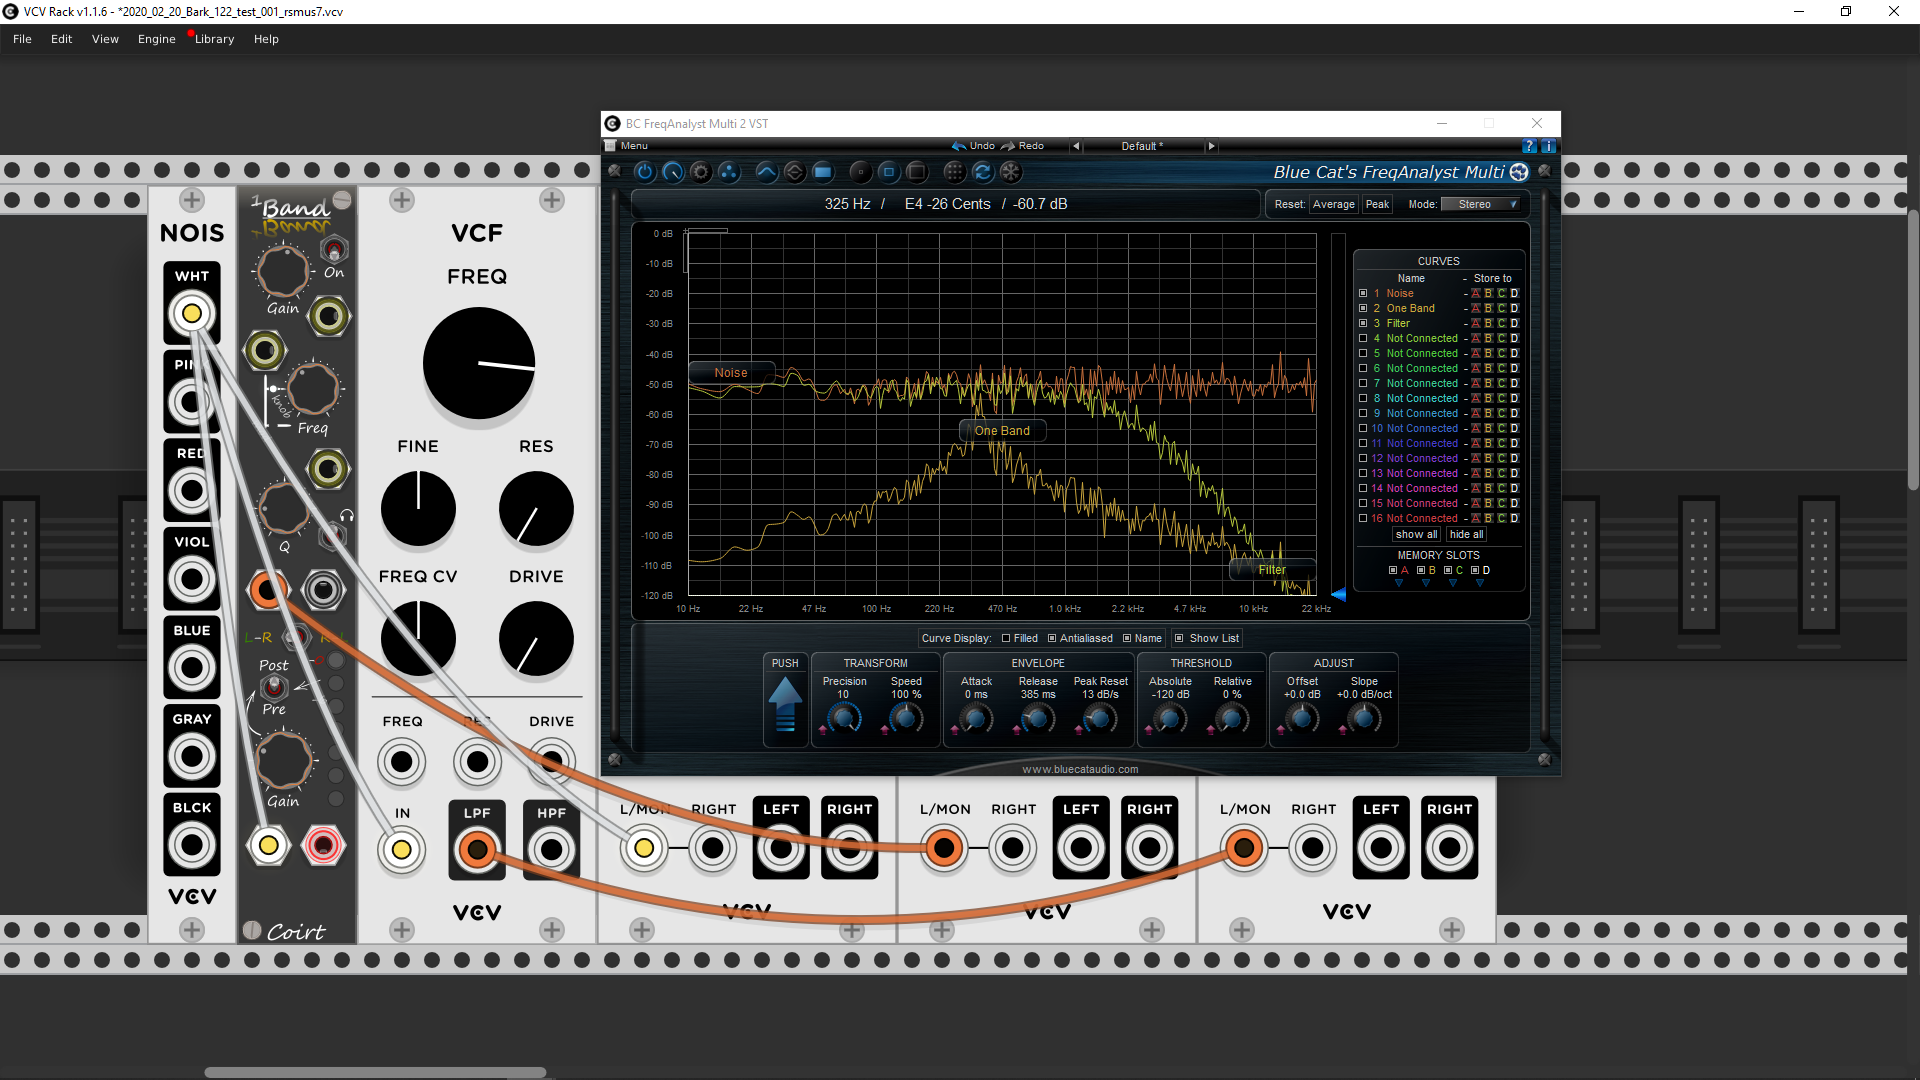
Impulse has a terrible crest factor, so if there is any noise in the filter it will be a problem. better is perfectly uniform noise, and best is a sinewave sweep. Have you looked at the Bogaudio FFT spectrum analyzers? They are very good.
You want a Bode plot of \log |H| vs \log f, right? You could use an oscillator to generate a pure sine sweep and look at the result on a frequency analyzer. Or you could generate a 1-sample impulse and look at that on an analyzer.
Or do you want a waterfall plot? Or an impulse plot? Or a plot of poles/zeros? I’m not clear what you want.
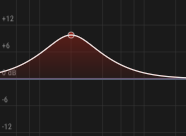
Usually (example on a biquad filters), I evalutate freq response with zeros and poles.
This give to me the graph of how each band is filtering, visually.
I’d like to do the same analysing others kind of filters, not mine, to see its freq response.
So, with filter that I don’t own code, I send a 1-sample impulse to span plugin (every, for example, 1024 samples), and I sync sample to that windows.
So, visually (on span plot), I can see the “response” slopes of the filter, as if the filter I’m analysing have a visual graph plot.