All sorted, debugger running, breakpoints working having removed STRIP as per above, happy bunny.
Yay! Every few months I think of finally retiring my emacs habit (Which I just realized I have now had for a long time…) and moving to VSCode. Maybe 2020 is the year to do that. Maybe.
1 Like
Love it, it cured my sublime habit overnight.
This helped very much; I went from never having used VSCode to successfully debugging with it. Thank you!
This thread has helped me get on my way to building my own modules using Visual Studio Code (and later full-blown Visual Studio), thanks so much to everyone involved!
In that spirit, I would like to share the following, and maybe add another useful tip for the next person to come along… It really bugged me to have to make changes to the Rack SDK files, as I didn’t want to have to keep changing them when I wanted to build a debug version, and I would prefer to leave my SDK folder untouched and keep my changes within the scope of my project. So I added the following targets to my Makefile, which allows me to switch between a debug and release build:
# When building for debugging, stop the debug symbols from being stripped, and set the optimization level to none
debug: STRIP = : DEBUG MODE, THIS LINE IS COMMENTED OUT:  strip
debug: EXTRA_FLAGS = -O0
debug: clean dist
	cp dist/"$(SLUG)"-"$(VERSION)"-$(ARCH).zip $(RACK_USER_DIR)/plugins-v1/

release: clean install
It pre-defines the strip variable to be a comment, so that the stripping does not take place, then adds a flag for no optimizations, which will be added after the normal flags, overriding them. Hope someone finds it useful!
1 Like
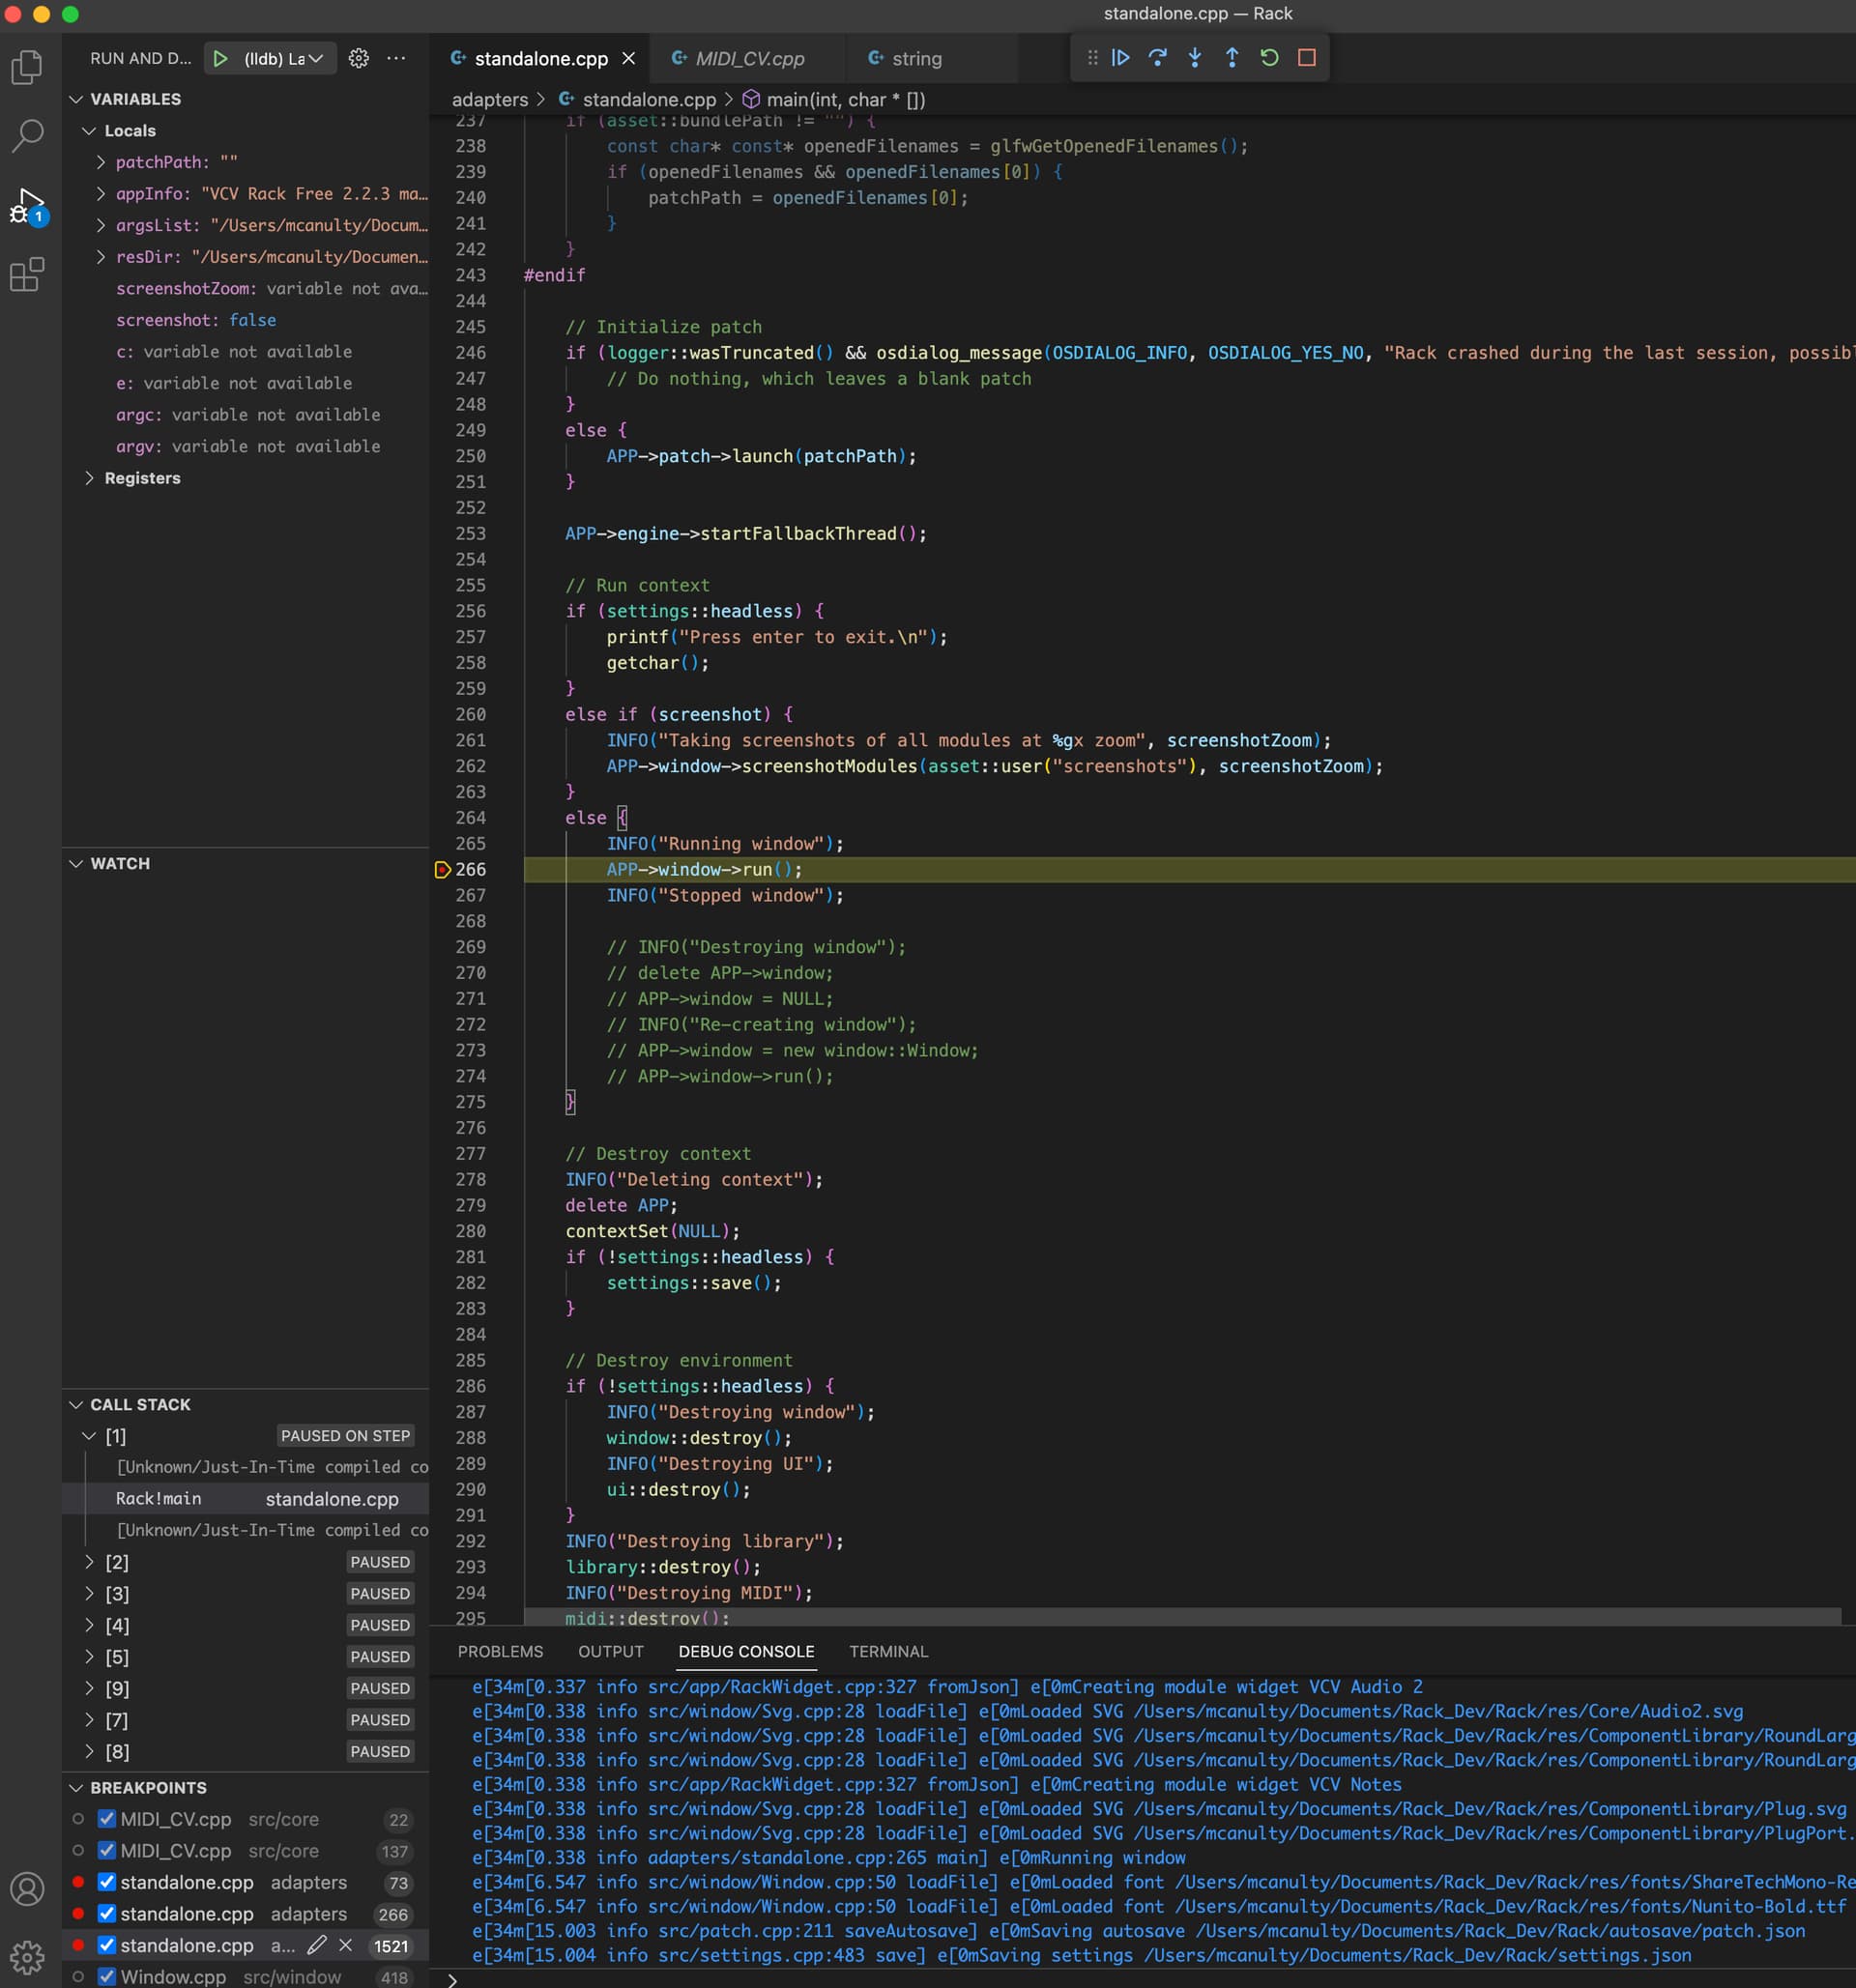
I’m trying to debug in VSCode on a mac, and I’ve successfully got compilation working, and the debugger is running, but as soon as I get to APP->window->run(); in main, I can’t seem to step into the code. Is that normal? Am I not building with the right debug flags possibly?
I have:
- removed the -O3 option from compile.mk
- commented out the strip call from plugin.mk
- switched BND_INLINE from inline to static in blendish.c
cleaned and recompiled but somehow everything inside of APP->window->run(); seems invisible to the debugger.
I’ll give it another crack tomorrow, maybe I need to start from a fresh clone, but thought I’d ask just in case anybody has a suggestion.
It’s my first time testing out the debugger on VSCode, I’m quite impressed with how well it integrates when it works.
You say you removed the -O3. I think you should not remove but replace the 3 by 0. At least that is what I have and it works for me.
Thanks, that didn’t seem to do it. I hammered at it today for a few hours with no luck. I’ll give it a try again tonight.
Switched over to windows, I have gdb working manually on the command line, but not integrating with vscode. In comparison I can see lldb definitely doesn’t seem like it has the same amount of debugging information. Which makes me think the issue on mac is with the compilation phase.
Windows was via virtual machine on Parallels, I’m going to give Ubuntu a shot on a VMware virtual machine.
No need for a response unless anybody has some sure-fire advice, but I figure I’ll leave some breadcrumbs for the future. Fingers crossed that Linux will give a smooth on-boarding experience for early dev work.
Holy moly, it all just works right out of the box on Linux.
Ubuntu 18.04: I did a fresh clone, then make debug on the command line, verified that gdb was working, then fired up a fresh install of vscode, installed the c++ extensions, used this for the launch.json
{

    "version": "0.2.0",
    "configurations": [
     {
            "name": "launch (gdb)",
            "type": "cppdbg",
            "request": "launch",
            "program": "${workspaceFolder}/Rack",
            "cwd":"${workspaceFolder}",
            "args":["-d"],
            "MIMode": "gdb",
            "miDebuggerPath": "/usr/bin/gdb",
            "launchCompleteCommand": "exec-run",
            "stopAtEntry": true,
            "setupCommands": [
                {
                    "description": "Enable pretty-printing for gdb",
                    "text": "-enable-pretty-printing",
                    "ignoreFailures": true
                },


            ]
        }
    ]
}
And the whole thing debugs like a dream.
I spent the whole rest of the day trying to get mac debugging to work, and went down a whole rabbit hole learning about how clang no longer outputs debugging information apparently, so you have to use dsymutil. But dsymutil kept complaining that there was no debugging information.
Ultimately I concluded that if I could get GNU gcc running, it would probably do the trick, but doing that on a modern mac seems a lot like that reverse flush direction machine from the Simpsons episode in Australia. And ultimately I gave up.
I think I will be doing my Rack development in Ubuntu.
Update - I also tested with Ubuntu 22.04 LTS and the installation, compiling, and debugging was similarly painless. I would recommend this route to anybody reading this thread.
But If anybody gets macOS Ventura to debug successfully, please let me know.
it really is possible (easy) to develop modules from the command line and debug with gdb. Plenty of the modules in the library were made that way.
That’s fair.
Although, in this case, lldb was not working on the command line either, it’s an issue with the debug information not being generated by Apple’s clang. But now that I have at least one toolchain working as expected, I decided to just stop pursuing those questions so I can spend more time reading the vcv code.
1 Like