I’ve also been wondering how this is supposed to work if rack is being hosted as a plugin where the host really believes it owns the SPP and you might be trying to trigger events on every eight of the hosts concept of a bar. Are there any mechanisms to deal with host playback starting in the middle of the second beat of the 27th bar? Or looping in an arranger view of Bitwig? Or hanging out in live’s clip launcher?
1 Like
That’s a good suggestion and is similar to how my Meander sequencer works, especially Meander for Windows which was a discrete event simulator/scheduler. Of course, you have to have the time signature in addition to the tempo to calculate when notes of different length are played, much like in Meander.
For this current test, I was imagining using BASICally to schedule different events at different times and then send the event occurrence info out an out port or out ports that would do various things in the patch, such as change a CV or do a trigger or a gate etc. A challenge is to schedule an event several arbitrary seconds or minutes in the future.
I may try your suggestion for fun, but, Meander already outputs triggers based on beats and note duration.
Thanks.
My thinking is strictly inside of Rack and not within the DAW etc. where the MIDI song position pointer is relevant. Meander for Windows was MIDI based and I did have to worry about SPP back in those days.
So, I really don’t know how to answer this question.
I think this is undefined for most (if not all) sequencer modules.
My apparent float precision problem was actually due to a FOR block in a ALSO block consuming time in an unexpected way. Now I am able to correctly send the elapsed time in seconds to an out port after /1000 and then using an AO-106 module to multiply the output by 1000.
So perhaps my concern about float precision was unwarranted.
@k-chaffin Color me fascinated by what I just discovered.
I just implemented time() and time_millis() in BASICally locally, and I thought to compare the time they keep to the ‘tick = tick + 1’ method, I then compute a ratio of (tick method)/(time() method). I get very different results, depending on VCV’s Engine->Sample Rate setting and the number of threads.
Note that each of these tests required restarting VCV Rack: changes to Sample Rate (for me at least), don’t happen until restart.
| threads | Sample Rate  | Ratio |
| 1       | Auto (44.1K) | 0.74  |
| 3       | Auto (44.1K) | 1.042 |
| 1       | 44.1 K       | 0.735 |
| 1       | 48 K         | 0.83  |
| 1       | 88.2 K       | 0.999 |
And even these values, I believe, may be changing from run to run. And the ratio isn’t that stable, either.
But here’s what surprised me; I had no idea that process() wasn’t called on every sample. The “tick method” absolutely assumed that it was. So, yeah, I’m now not at all surprised that counting ticks doesn’t work for what you’re doing.
So, yes, these new time methods will help a lot, for other cases (like Oscillators) as well.
@Andre_M, I’m not super clear what you’re trying to do, but here’s some code that does a three-stage attack-sustain-release envelope with a gain control:
' Notes start when IN9 gets a trigger.
' Input signal goes into IN1.
' OUT1 is resulting signal.
' 'gain' sets overall gain of VCA
' attack, sus, and decay are A,S, and R

when trigger(in9)
  for i = 0 to attack
    out1 = in1 * i / attack * gain
  next
  for len = 0 to sus
    out1 = in1 * gain
  next
  for i = 0 to decay
    out1 = in1 * (1 - i / decay) * gain
  next
end when

when start()
  gain = 0.7
  attack = sample_rate() * 0.1 ' 0.1 seconds
  sus = sample_rate() * 0.5 ' 0.5 seconds
  decay = sample_rate() * 0.4 ' 0.4 seconds
end when
3 Likes
I’ll try it tomorrow! Thanks
Very interesting! I look forward to trying the new time functions when available. Thank you for implementing them. Hopefully others will find creative uses for them also.
It was probably a threading issue that was causing me to have time that was as nearly as I could tell off by a factor or 2 (or 1/2) depending on how you look at it. I suspect it was due to a “hidden WAIT 0” issue. I have my Rack engine threads set to 1, BTW.
What is the correct wording? Is process() called once for each "block"size of samples?
It really appears to me that process() is being called once per sample. I have things working correctly using the sample counting method, at least for a 10 second delayed event.
I won’t categorically say that “process() is not called on every sample”. I’m saying my observations indicate that there are circumstances under which the number of times that process() is called in a second is different from the sample_rate().
1 Like
sure, because a buffer gets processed in less time than it takes to play it. So in real (wall clock) time you get a bunch of samples, all processed at a little higher than sample rate, then a pause where nothing gets processed. But withing the entire “audio graph” there isn’t anyone who cares about wall clock time (normally), everyone just cares about sample time, and the fact that the two aren’t exactly the same at any given instance doesn’t (usually) matter.
1 Like
I suppose I can say that on the average across several seconds, process() gets called once per sample or as many times as there are samples in those several seconds. Typically, I am looking over a 10 second window. Of course I am using a mechanical stop watch to compare sample computed time to external clock time. I wouldn’t be able to see a few percent difference.
Here I will present more (I think) evidence that sample_rate() is not always that close to the number of times that process() is called:
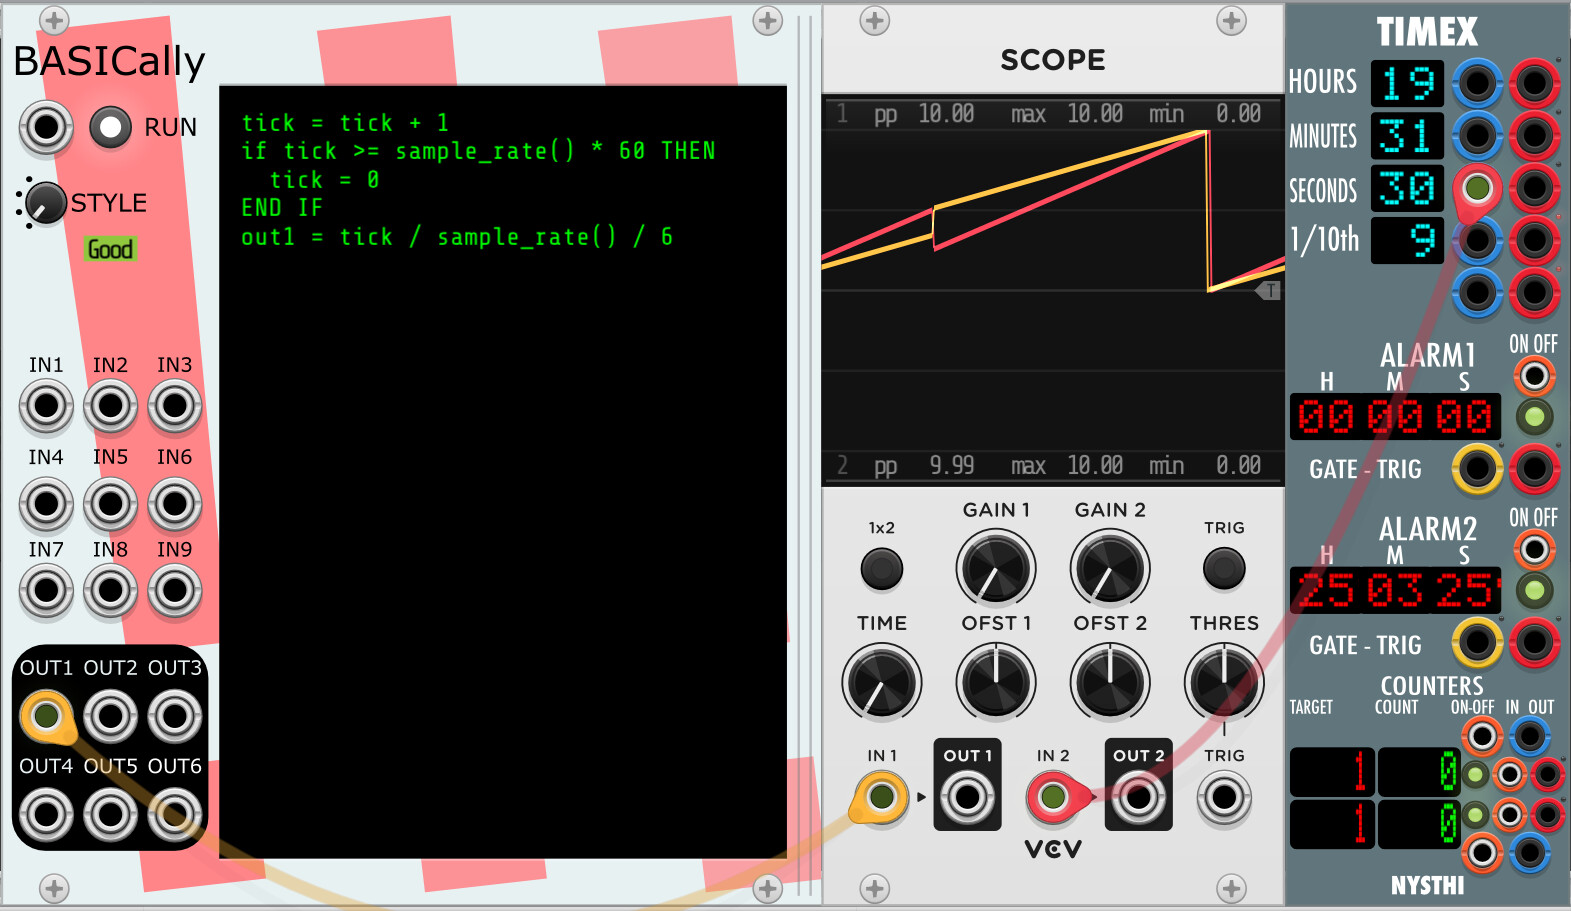
I’ll state what I believe is happening:
- The Timex port ranges from 0.0 to 10v over the course of 60 seconds. Since Timex is lined up with the wall clock, it’s just dividing the current second by six.
- The little BASICally program just counts ticks (which I believe correspond 1-1 with calls to process()), then divides it by the sample_rate() (thus the number of seconds that have passed) and then by six (just like Timex does). It resets tick to zero every 60 seconds.
- So these are doing the same thing, albeit not in sync.
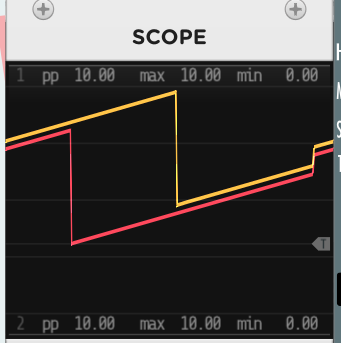
I suggest to you that the fact that the lines are not always parallel is evidence that (process calls / second) != sample_rate(). And not in a momentarily changing way, either, but pretty consistently.
Like I said earlier, on my (Windows) system, the slope difference seems to depend on what my SampleRate and Thread count is. It might depend on other things: OS, system load, whatever. I’d love to see what other people’s results are at different local settings.
Of course, there are other explanations; maybe BASICally doesn’t really run the code every time process() is called? Maybe the sample_rate() I’m getting from args is wrong? I’d love to know it if those things were true.
I’m not quite at the point where I hack a module just to count process() calls and report them to the log along with the time, but…hey, I’d be really curious what it said.
1 Like
I set up your test patch under Window 11 but I still have the 4 port version of BASICally. During my first test, the lines are parallel albeit not synced on the start time. This is with my sample rate set to 44.1 kHz and 1 thread.
Setting threads=2 caused the patch to stop processing and required me to kill Rack.exe in the task manager. No obvious issue the log file other than no end success message, so Rack reported crash when I started it back up. After starting up, the patch is processing but BASICally scope trace is flat lined and Timex is progressing as expected. This may be important to you but may be a result of changes you have made with threading in your test version, which I do not have.
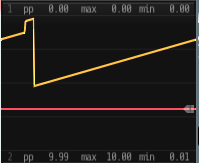
After changing the threads back to 1 and restarting Rack, the dual traces are back to parallel but phase shifted as before.
If I change the sample rate to 48 kHz, the traces are still parallel.
During my tests, the traces are always parallel, but as mentioned, I do not have your latest BASICally test version. Have you made threading changes in that version?
I installed your latest beta build and the crash on threads>1 went away. Traces remain parallel for 1, 2 or 3 threads, which is all I tested. Traces remain parallel with threads > 1 and sample rate 48 kHz .
So, on my Windows system, traces always remain paralell.
Let me know if you would like for me to test anything else.
I just want to mention that the time() function is working very well in my event scheduler and handler. I have a scheme identified whereby I could have several events with unique identifiers and event types and event values and send those states out on multiple out ports and have other modules decode the outputs and do whatever action I choose.
It remains to be seen how far I take this. There are probably easier ways to generate events than via the BASICally scripting. I currently use clocked sequencers to schedule cyclical discrete CVs in my music.
A use case I expected for BASICally was as a way for module developers to try out ideas and see if they are worth investing the effort of turning into their own modules.
1 Like
I think that is a very reasonable expectation. Thanks for creating this opportunity.
Version 2.0.7 is now live in the library. Additions include:
- Added notion of “ALSO blocks” that run in parallel.
- Added notion of “WHEN blocks” that are started when a condition is met.
- Added “CLEAR ALL” command, which sets all variables to zero and empties all arrays.
- Added “RESET” command, which interrupts all blocks and restarts them from the beginning.
- Added start() and trigger(INn) functions, to know when the program has just been compiled or a trigger has been received.
- Added log2(), loge(), and log10() functions.
- Added time() and time_millis() functions for tracking the execution time more easily.
- Added some factory Presets illustrating some interesting features of the module.
- Added two more OUT ports, for a total of six.
- Added the ability to “unclamp” OUTn ports; they are normally limited to the range -10 <= x <= 10. Useful for debugging scripts.
- Fixed a few couple UI bugs, including undo/redo crashing Rack at times.
- Made the screen a couple of lines taller.
Thanks to @k-chaffin, @DaveVenom, @Andre_M, @FiroLFO, and anyone else who’s been playing with BASICally.
For you uber-nerds, here’s the loopiest, “I’m just curious if it would work” thing I’ve done with it; passing data internal between module instances via a cable and a protocol:
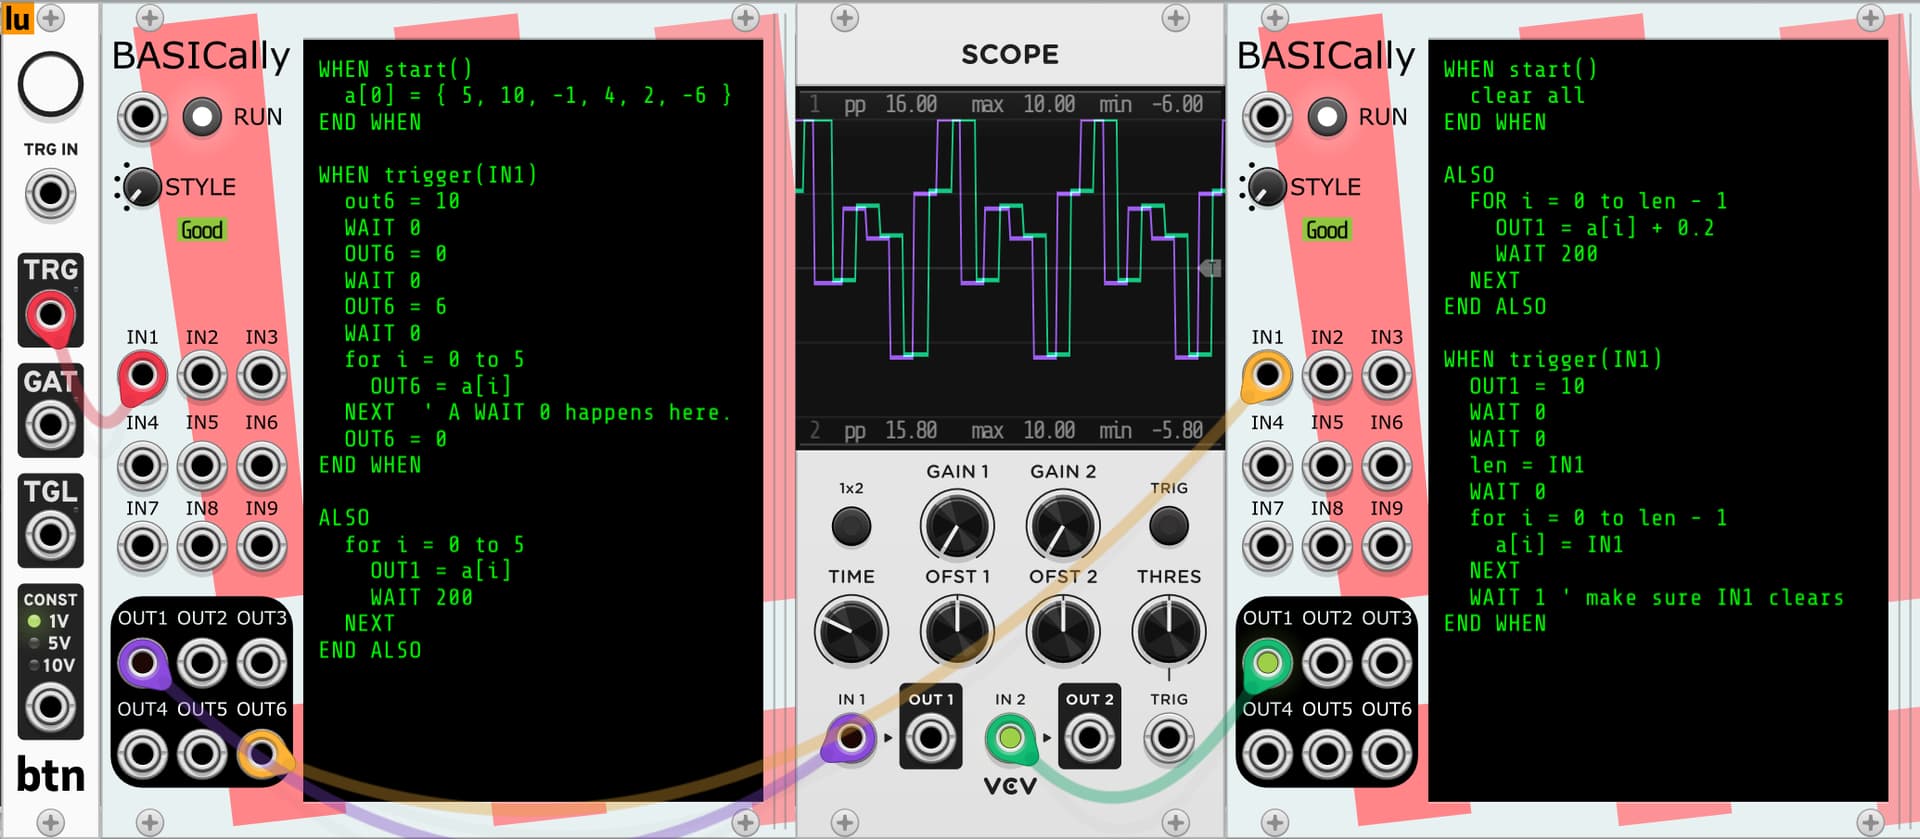
The sender code (on the left):
WHEN start()
  a[0] = { 5, 10, -1, 4, 2, -6 }
END WHEN

WHEN trigger(IN1)
  out6 = 10 ' Send trigger to wake up receiver.
  WAIT 0
  OUT6 = 0
  WAIT 0
  OUT6 = 6 ' Send array length.
  WAIT 0
  for i = 0 to 5
    OUT6 = a[i]
  NEXT  ' An implicit WAIT 0 happens here.
  OUT6 = 0
END WHEN

ALSO
  for i = 0 to 5
    OUT1 = a[i]
    WAIT 200
  NEXT
END ALSO
The receiver code (on the right):
WHEN start()
  clear all
END WHEN

ALSO
  FOR i = 0 to len - 1
    OUT1 = a[i] + 0.2
    WAIT 200
  NEXT
END ALSO

WHEN trigger(IN1)
  OUT1 = 10 ' Just to show that I'm receiving.
  WAIT 0
  WAIT 0
  len = IN1
  WAIT 0
  for i = 0 to len - 1
    a[i] = IN1
  NEXT
  WAIT 1 ' make sure IN1 clears
END WHEN
When you press the trigger (far left), the sender sends the length of the array and all of the array data to the receiver, who then outputs a slightly modified version of it. I can imagine all manner of “distributed” processing models or subroutine calls could be implemented in this absurdly hacky way.
7 Likes